A step-by-step guide for SMEs on defining EDG project KPIs and outcomes that assessors trust—covering baseline-setting, metric selection, evidence requirements, and common pitfalls that lead to clarifications or claim disallowance.
At a glance
- EDG outcomes are capability-based, not vanity metrics.
- KPIs must link clearly from baseline → intervention → outcome.
- Vague or aspirational metrics increase clarification and claim risk.
- Assessors prioritise measurability, attribution, and sustainability.
Table of contents
- What assessors mean by “outcomes”
- The anatomy of a credible EDG KPI
- Setting defensible baselines
- Choosing the right metric types
- Evidence required at claim stage
- Common KPI mistakes to avoid
- Examples of strong vs weak KPIs
- References
- Call us now
What assessors mean by “outcomes”
In EDG, outcomes are demonstrable capability improvements resulting from the approved project—not activities completed.
Assessors look for outcomes that:
- reflect meaningful business change
- persist after the project ends
- can be reasonably attributed to the project scope
Completing deliverables alone is insufficient without outcome linkage.
The anatomy of a credible EDG KPI
A strong EDG KPI has four components:
- Clear baseline
- current-state performance or capability
- Defined intervention
- what the project actually changes
- Measurable post-state
- how improvement is quantified
- Attribution logic
- why the improvement is due to the project
If any component is weak, assessors lose confidence.
Setting defensible baselines
Baselines should be:
- specific to the company
- measurable before project start
- documented or reasonably evidenced
Examples of acceptable baselines:
- current cycle time (days)
- current error or rework rate (%)
- current manual effort (man-hours/month)
Avoid baselines that are:
- industry averages
- aspirational targets
- undocumented assumptions
Choosing the right metric types
Operational metrics
Useful for process and productivity projects:
- cycle time reduction
- throughput improvement
- error rate reduction
Capability metrics
Common for strategy and transformation projects:
- new internal competencies established
- governance frameworks implemented and adopted
- decision turnaround time improvement
Financial proxies
Often acceptable when direct financial impact is premature:
- cost avoidance
- productivity-equivalent savings
- revenue enablement indicators
Metrics must be reasonable for the project scope and duration.
Evidence required at claim stage
At claim stage, assessors may request:
- before-and-after comparisons
- system screenshots or logs
- internal reports or SOPs
- adoption or usage records
If evidence requirements are unclear at design stage, KPIs are likely under-specified.
Common KPI mistakes to avoid
- Outcome inflation
- claiming benefits disproportionate to scope
- Unmeasurable language
- “enhance”, “optimise”, “improve visibility”
- Activity masquerading as outcomes
- workshops conducted ≠ capability achieved
- No attribution logic
- improvements that could have happened anyway
These often trigger clarifications or partial claim disallowance.
Examples of strong vs weak KPIs
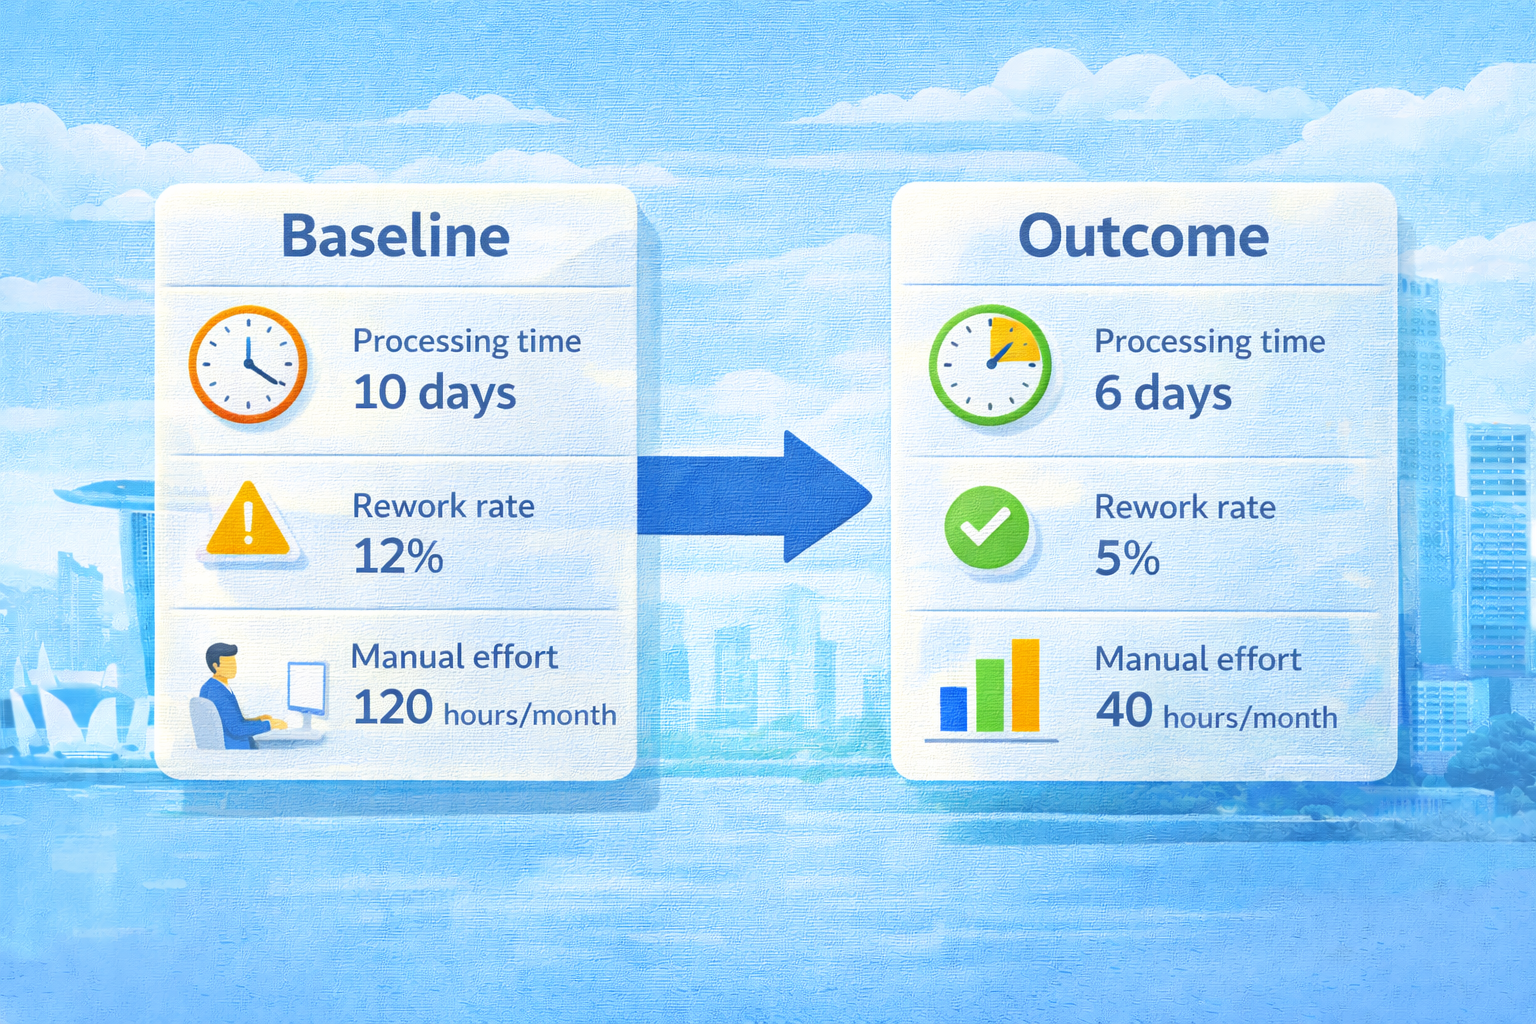
Example A — Strong KPI
- Baseline: 10 days average processing time
- Post-project: 6 days average processing time
- Evidence: system timestamps and reports
Result: high assessor confidence
Example B — Weak KPI
- “Improved operational efficiency”
- No baseline or measurement method
Result: clarification or rejection risk
References
Related Resources (Grant-Consulting.org)
Official references
Call us now
Book a 20-minute consult (no obligation):
https://www.grant-consulting.org/contact
We can help you:
- design KPIs assessors trust
- align outcomes with project scope
- reduce clarification and claim risk